How to Read DaVinci Resolve Scopes: A Simple Guide
For many creators, shooting is done on a phone. The camera's auto color adjustments can't always get it right. You may end up with pure blacks that are crushed, blown-out highlights, color shifts, or a picture that looks soft and unclear.
If you use DaVinci Resolve, you can spot lots of problems by looking at the monitor. But when it's time to actually start color grading, you might not know where to begin. That's why Resolve includes scopes — tools that help you diagnose and fix most color and exposure issues.
A lot of online tutorials about Resolve's scopes are pretty much the same. They start by explaining what each waveform or graph means. That's important — without that background, you won't know what you're looking at. But few tutorials show how to use the scopes to judge what's wrong in a real image.
So in this article, we've put together a clear guide on how to read Resolve's scopes and how to use them to find and fix picture problems. We hope you find it helpful.
In this article, you will learn:
- Where to Open the Scopes?
- How to Read Scopes in DaVinci Resolve?
- How to Use Scopes in DaVinci Resolve for Color Grading?
- Conclusion
Where to Open the Scopes?
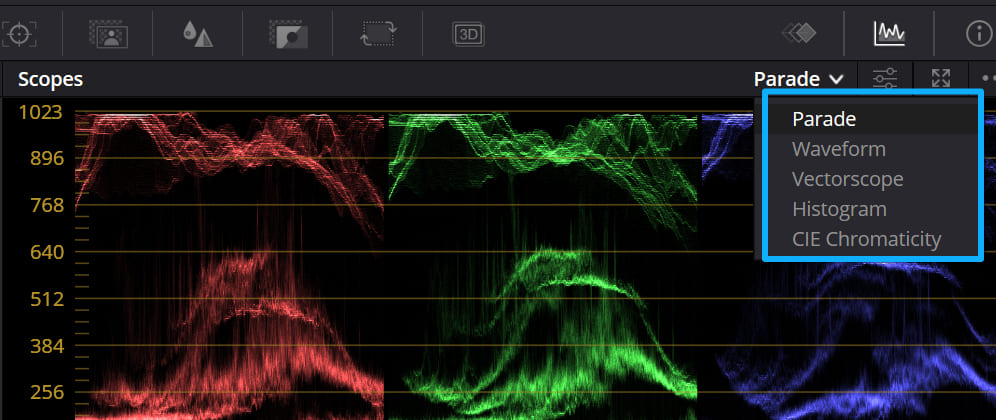
Switch to the Color page. On the right side of the color toolbar, you'll see a curve icon — click it to open the Scopes panel. In the panel's dropdown, you can pick which scopes to show (Waveform, Parade, Vectorscope, Histogram, etc.).
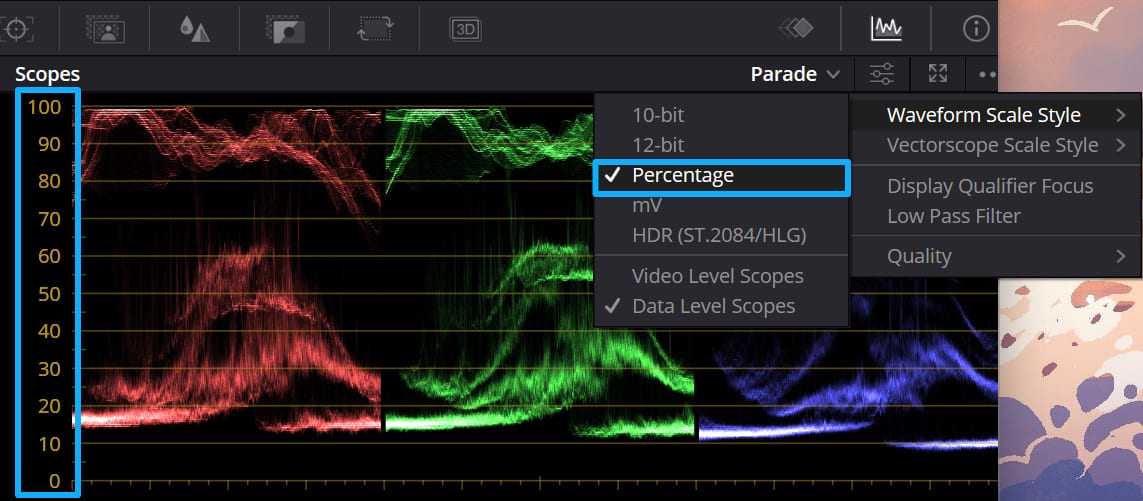
One more step before you start using the scopes. Click the scopes' ellipsis (...) icon and set Waveform Scale Style to Percentage. This changes the scale from 0–1023 to 0–100, which makes it easier to compare the scopes with other tools.
How to Read Scopes in DaVinci Resolve?
1. Parade
What the axes mean: The vertical axis shows luminance (brightness). The horizontal axis shows the three split channels — Red, Green, and Blue — side by side.
What it shows: Parade displays the color balance across the image. Each channel's trace tells you how much of that color is present in different brightness ranges.
In the image below, the highlight area from about 70–100 shows that the green channel is highest, and the blue channel is lowest. That means the highlights lean green.
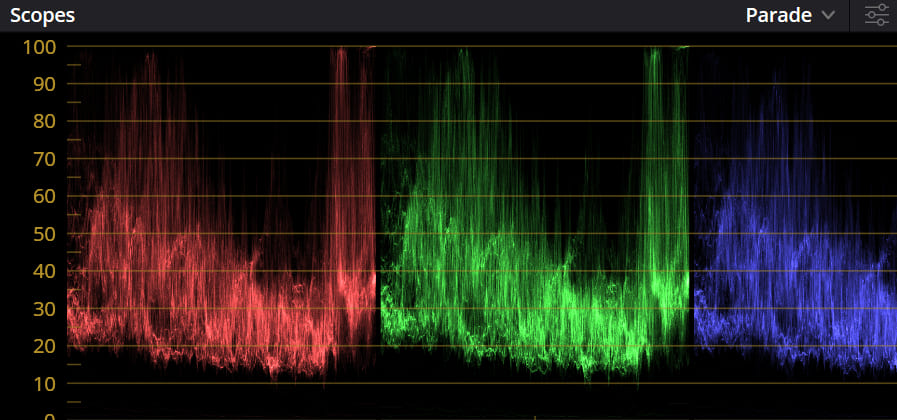
Why it's useful: The Parade is best for checking color balance and white balance.
2. Waveform
What the axes mean: The vertical axis shows luminance (brightness). The horizontal axis shows the image's left-to-right position.
What it tells you: The waveform plots, for each horizontal position, how the pixels' brightness and color are distributed vertically. The value 50 is midtone — not bright, not dark. If most pixels fall below 50, the image looks dark. If most pixels sit above 50, the image looks bright.
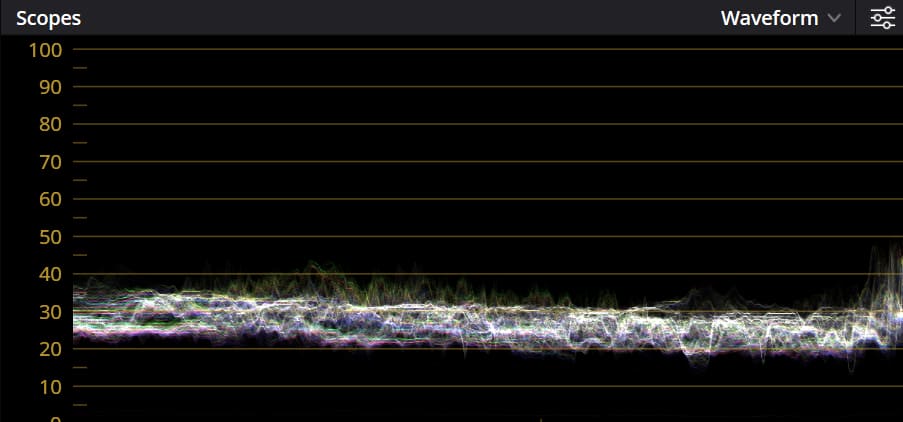
Why it's useful: The waveform is the go-to scope for exposure and contrast checks. Overexposed pixels show up above 100. Crushed blacks show up below 0. If the waveform is narrow and clumped in one area, the image lacks contrast. If it's stretched out, the image has stronger contrast.
For example, the waveform below shows that the image lacks contrast.
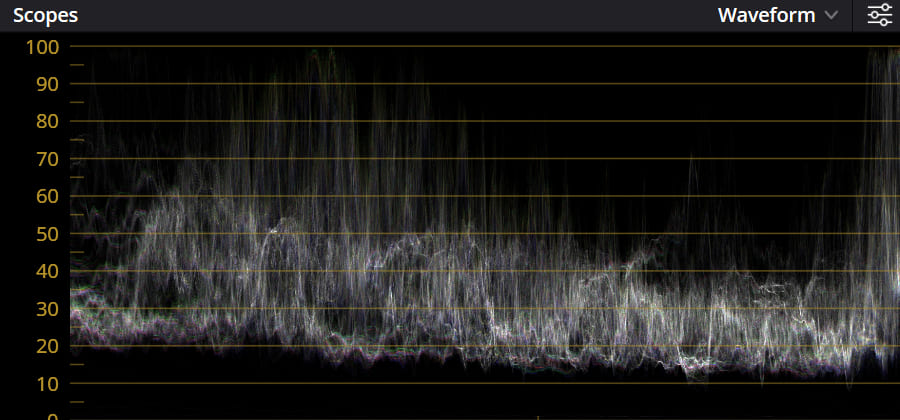
By contrast, the waveform below shows that the image has strong contrast.
3. Vectorscope
The vectorscope doesn't use left-to-right or up-and-down axes — it's a circular (polar) chart.
It shows hue and saturation. The farther a point is from the center, the more saturated that color is. The closer to the center, the less saturated. The direction the trace points tells you the hue.
For example, if the trace clusters mostly toward yellow, the image will read as yellow.
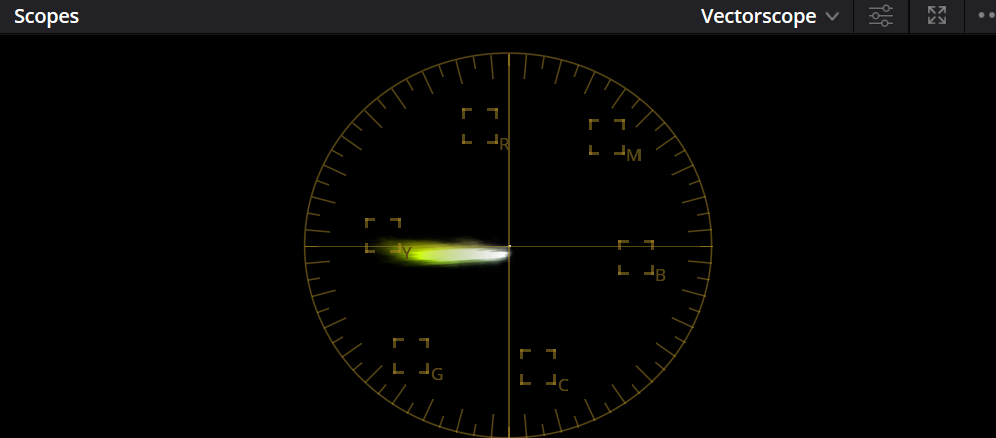
Use the vectorscope to check the overall color cast and to help fine-tune skin tones.
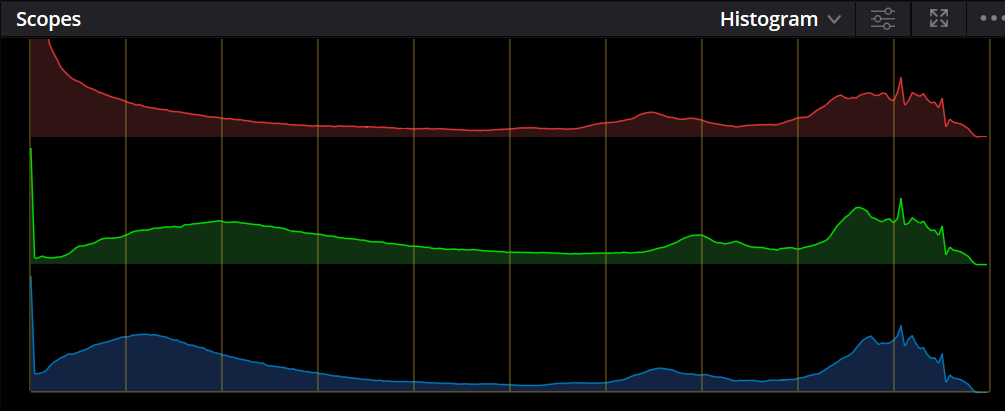
4. Histogram
What the axes mean: The horizontal axis shows brightness, from pure black on the left to pure white on the right. The vertical axis shows pixel count — how many pixels sit at each brightness level.
What it tells you: The histogram shows the image's overall exposure and tonal distribution. Like the waveform, if the graph is pushed to the left edge, it means crushed blacks. If it's pushed to the right edge, it means blown highlights (overexposure). How spread out the graph is tells you how much contrast the image has.
The histogram and waveform do much the same job. The waveform is usually more precise for reading pixel distribution. The exact number of pixels at each level matters less for everyday color grading, though it can be useful in very technical or high-end film work.
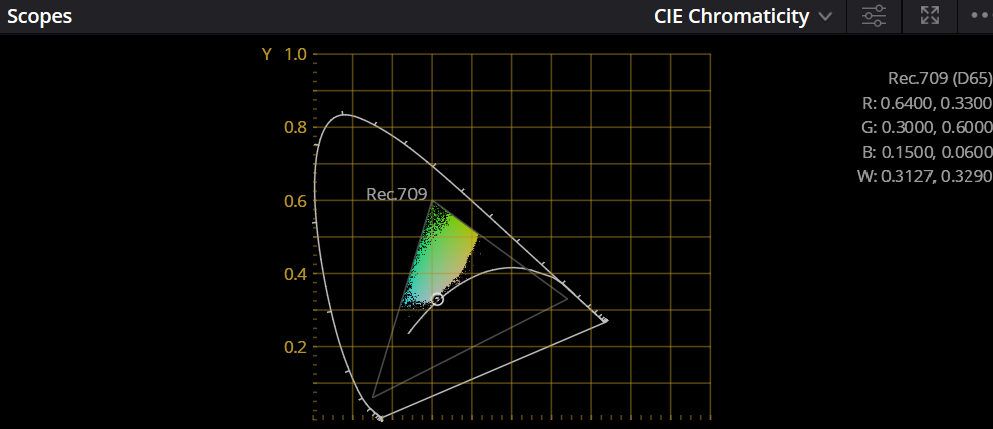
5. CIE Chromaticity
The CIE Chromaticity diagram is a circular 2D chart that shows hue and color purity (saturation). If you're familiar with color spaces, this scope will look familiar.
The chart usually uses x and y coordinates. Each point on the chart represents a color. It does not show brightness. Points farther from the center are more saturated. Points near the center are closer to neutral gray.
In professional grading, it's commonly used to check whether colors fall outside the target gamut (for example, Rec.709 or Rec.2020), to find color casts, to fine-tune key colors like skin tones, and to match multiple cameras.
In short, CIE is an advanced tool for controlling gamut and hue. It's most useful for projects with delivery specs or when you need precise matching. For most creators and editors, it's not something you'll use every day.
How to Use Scopes in DaVinci Resolve for Color Grading?
Now that you know the basics, let's walk through a concrete grading example to make things clearer.
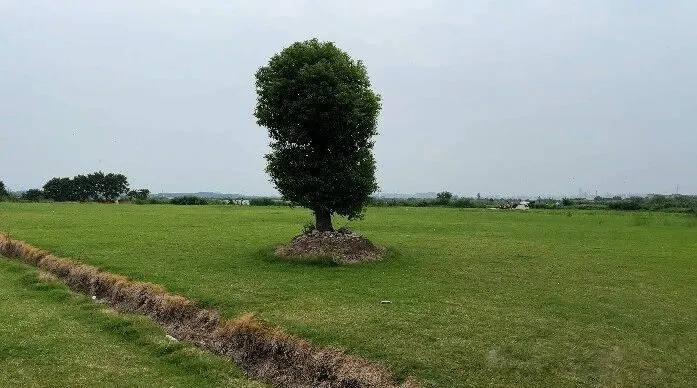
Open a clip on the Color page and check the waveform first. Problem areas in the image usually show up as distinct features on the waveform.
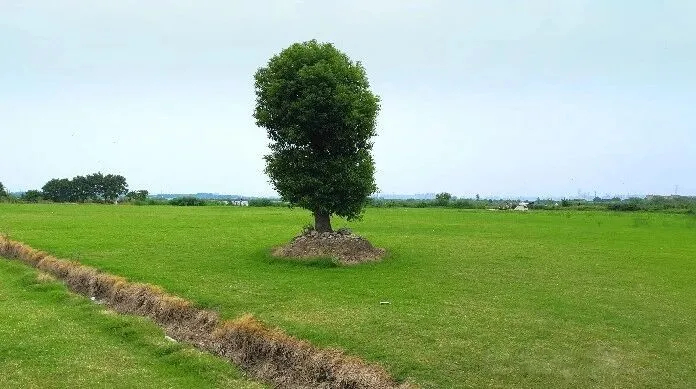
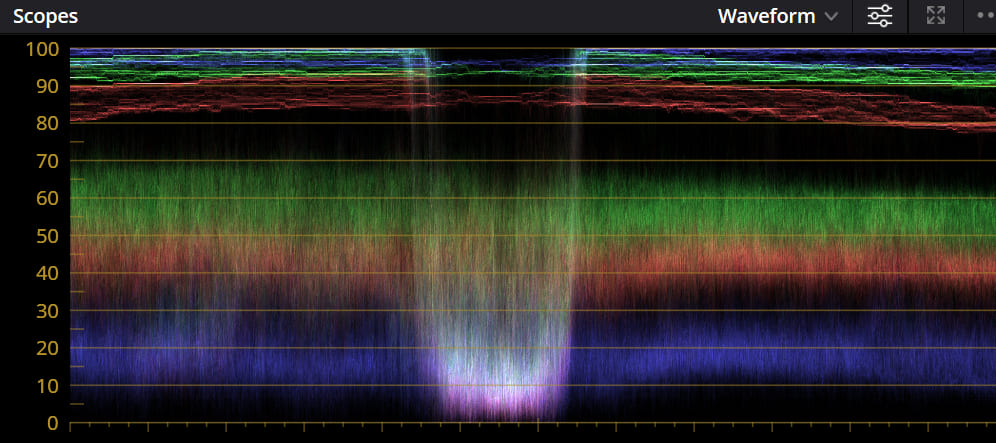
In this shot, the waveform drops below the bottom around the 0–10 range on the vertical axis and near the middle on the horizontal axis. On the picture, that matches the trees — they are crushed black. The waveform points you straight to the area that needs fixing.
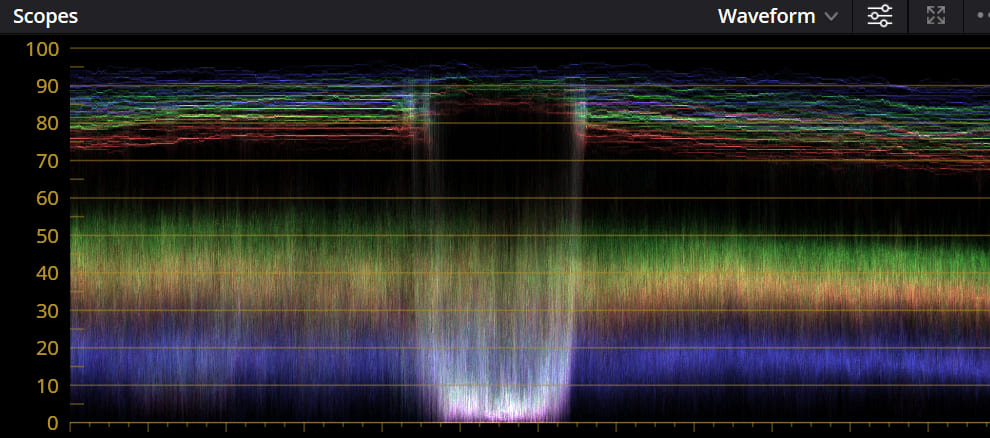
Next, look at the 70–100 range on the vertical axis. The three-channel traces are bunched together and show some bright/white spikes, unlike the more spread-out traces in the 10–60 range.
Looking at the image, that area corresponds to the sky. The sky looks dull and gray, with muted color. In this case, you want to open up the waveform for that range (give the sky more separation or contrast) and tweak the RGB channel mix so the sky's color comes back to a natural place.
Not every white-looking spike on the waveform means the image has a tonal problem. You still have to judge it against what the picture actually shows.
In the example above, the sky shouldn't be that bright, so those white spikes need to be separated. If the area really is white in the image, then white spikes are fine. But there's a common kind of white that usually signals trouble — like the example below.
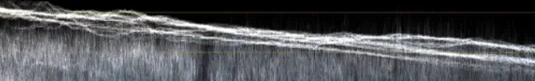
When the traces are heavily clustered, the corresponding part of the image will probably look flat and lack detail. Use Curves or HDR color wheels to spread the waveform out. That will bring back tonal separation and detail.
Back to the main point: after diagnosing the issue on the waveform and making a few adjustments, the image looks normal again. We won't list the exact steps here — let's just look at the corrected result.
You'll notice the crushed blacks were lifted — the trees now have more depth and detail. The sky's trace was separated, so it no longer looks flat, and the color feels nicer. We also tweaked the brightness and color of the grass. Now let's check the waveform again.
On the waveform, the highlights still stick a little past the 100 ceiling — slightly overexposed. Normally, you don't want blown highlights. But this is also a matter of taste.
A touch of overexposure can look more pleasing than a perfectly restrained image, so we kept this grade. Grading should be flexible. Don't get stuck on strict rules. Use your judgment and make choices that serve the picture.
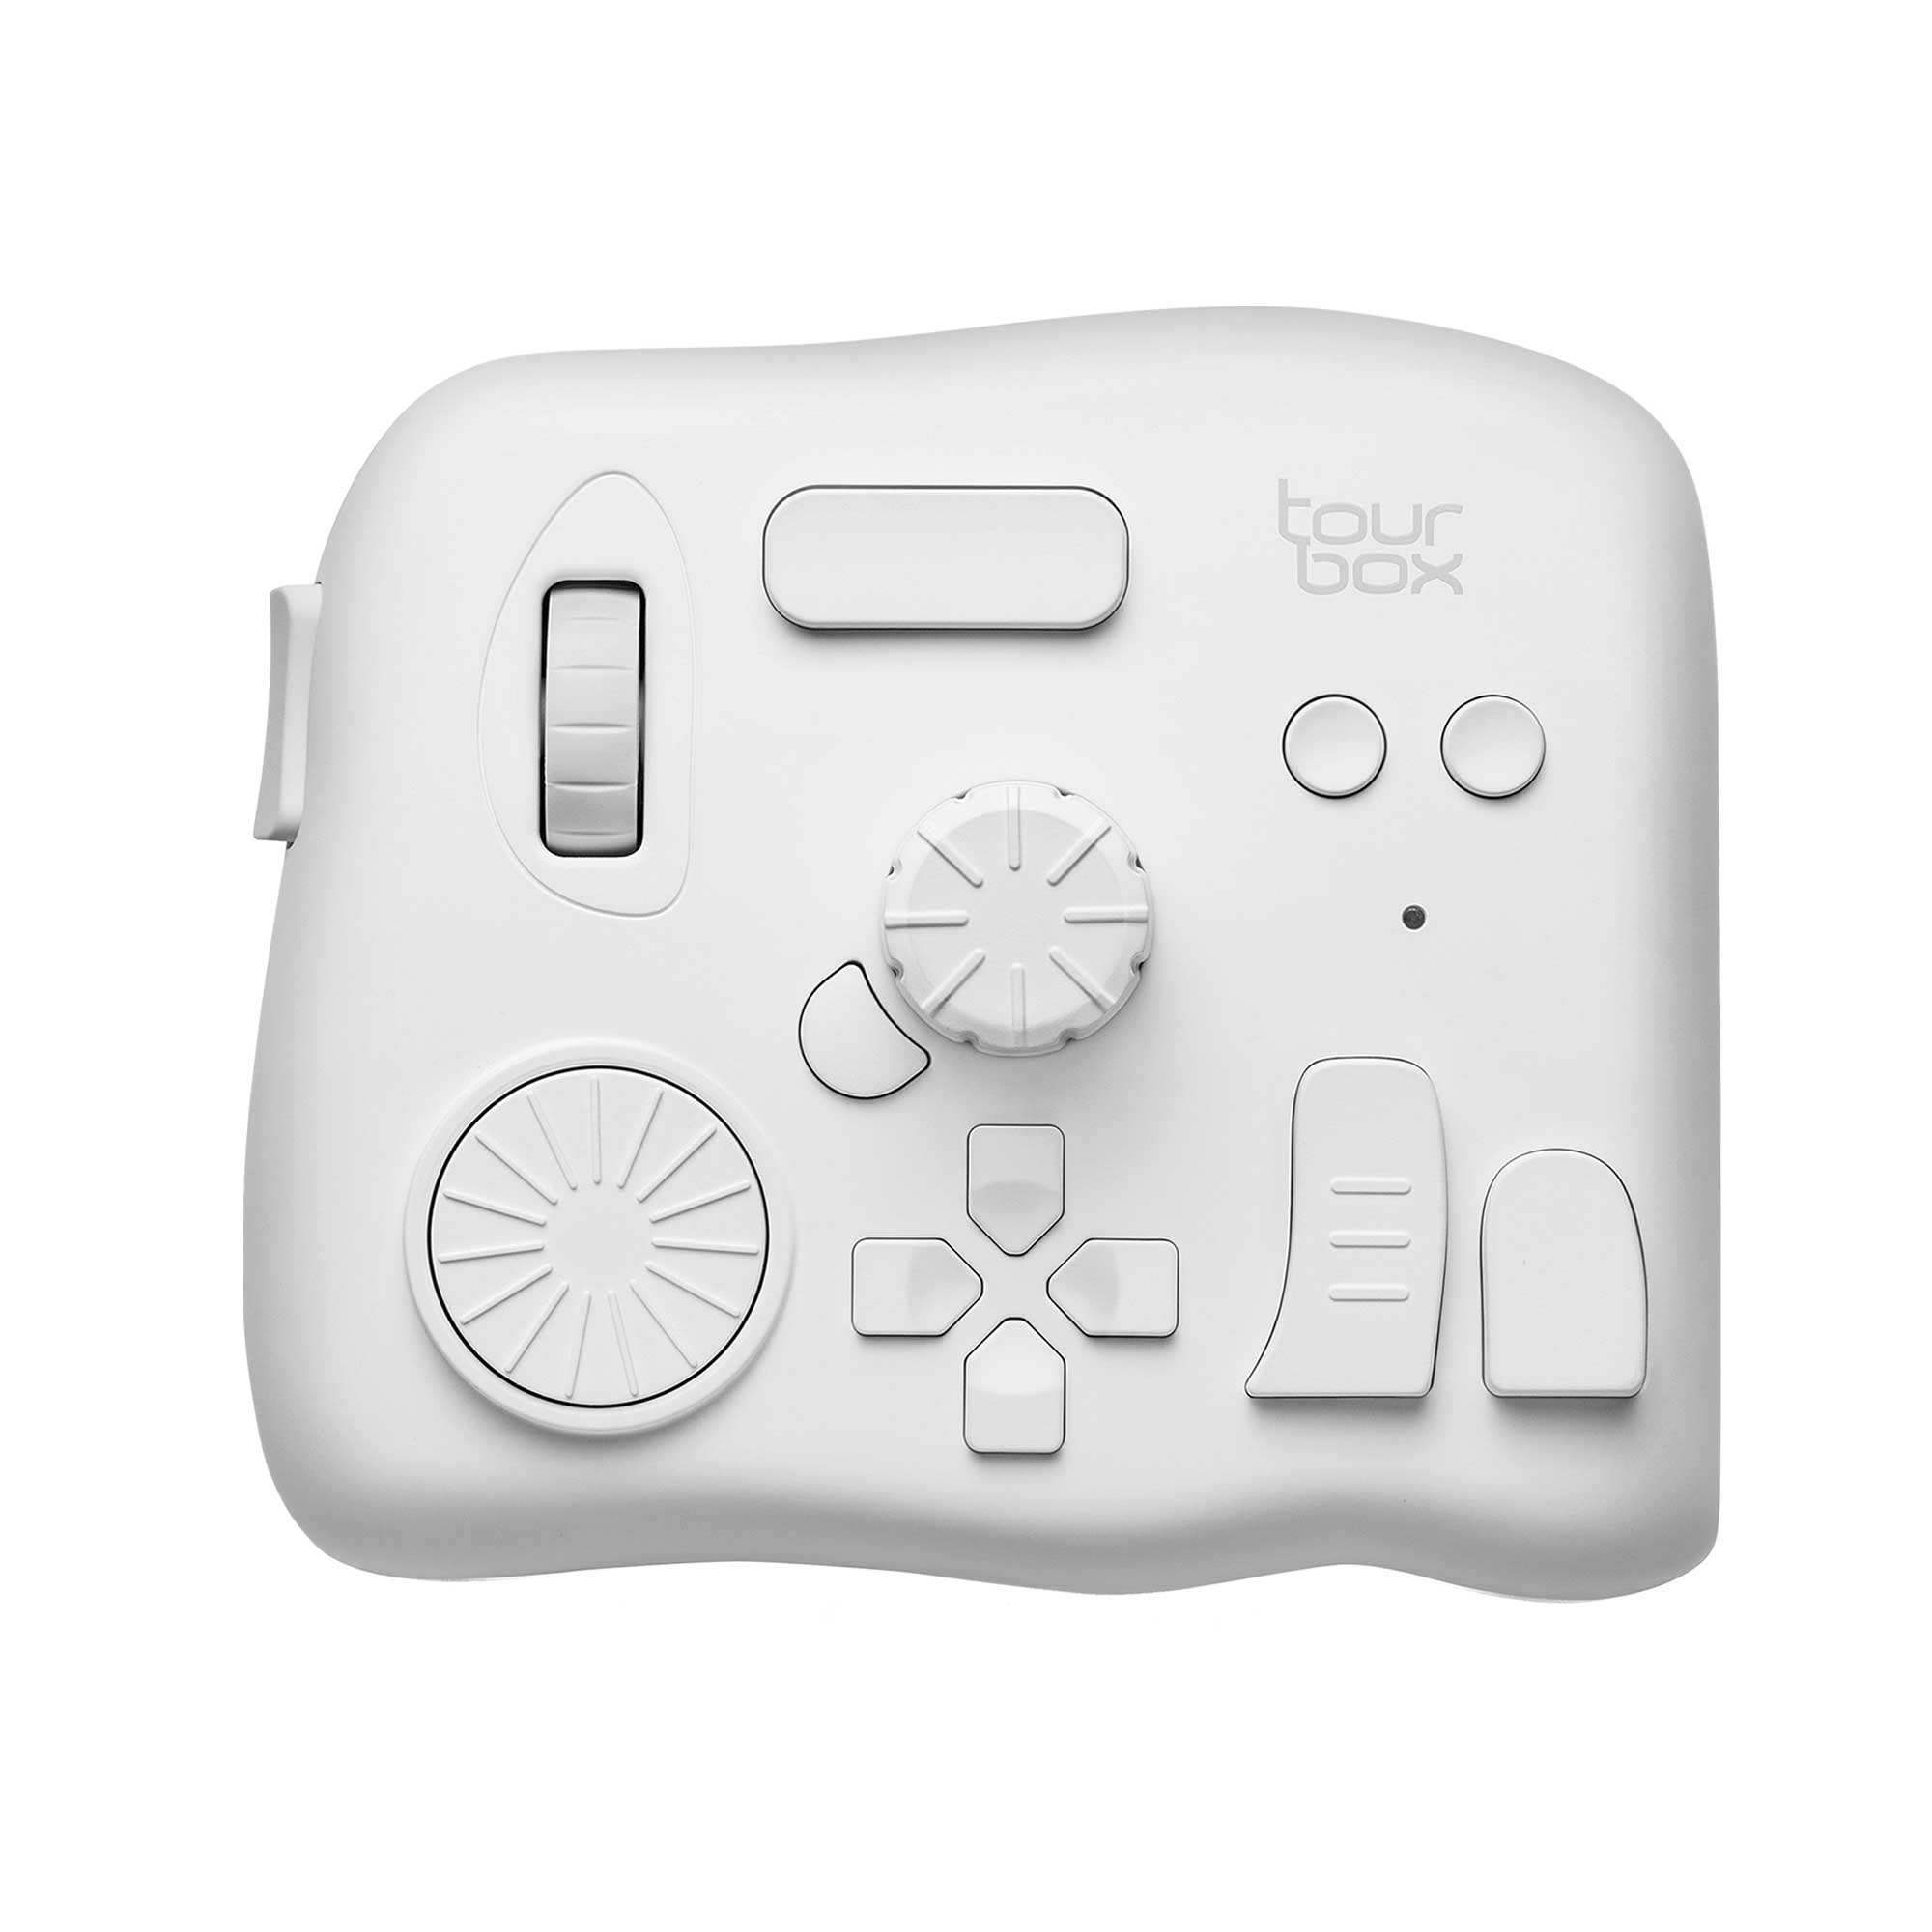
Quick ad break. If you use DaVinci Resolve a lot, you've probably heard of Blackmagic Design's Edit Keyboards. They speed up editing and grading a lot and are a top choice for pros. The downside: they only work with DaVinci Resolve.
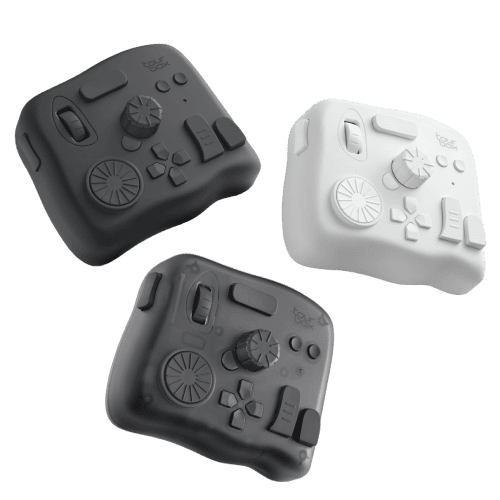
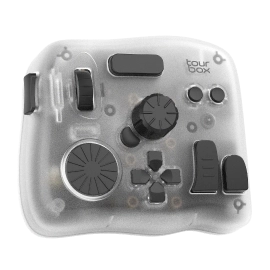
A cheaper, more flexible alternative is TourBox. It can map Resolve shortcuts and functions, and it has built-in features like HoverAdjust to help with grading. That gives you a similar workflow to an Edit Keyboard—or even a grading console—at a much friendlier price.
If you're curious, check out our DaVinci Resolve page for more info.
Conclusion
To wrap up: when you first open a clip, check the waveform to see if pixels hit the top or bottom limits (blown highlights or crushed blacks). Compare the scope to the picture and look at whether traces are clustered or nicely spread out. That helps you fix contrast and color balance.
After that, do localized secondary tweaks, adjust the overall color mood, and add any filters or effects you want. That's the basic color grading flow. Hope this simple DaVinci Resolve scopes guide helps you.